資訊內(nèi)容
一分鐘學(xué)會(huì)用Python的第三方庫(kù)openpyxl畫(huà)真散點(diǎn)圖
 uwA少兒編程網(wǎng)-https://www.pxcodes.com
之前在博客上看見(jiàn)不少類(lèi)似的問(wèn)題,點(diǎn)進(jìn)去一看,發(fā)現(xiàn)都是完全照抄的*方文檔。然而*方文檔的demo,畫(huà)出來(lái)并不是我們想要的效果:uwA少兒編程網(wǎng)-https://www.pxcodes.com
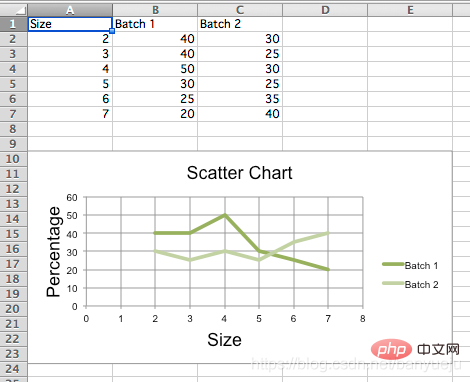
說(shuō)好的散點(diǎn)圖,出來(lái)卻是我們一般定義上的折線(xiàn)圖。
uwA少兒編程網(wǎng)-https://www.pxcodes.com
直接上代碼:uwA少兒編程網(wǎng)-https://www.pxcodes.com
先安裝openpyxl第三方庫(kù),以Windows為例,在cmd指令窗下發(fā)如下命令:uwA少兒編程網(wǎng)-https://www.pxcodes.com
pip install openpyxlPython代碼如下:uwA少兒編程網(wǎng)-https://www.pxcodes.com
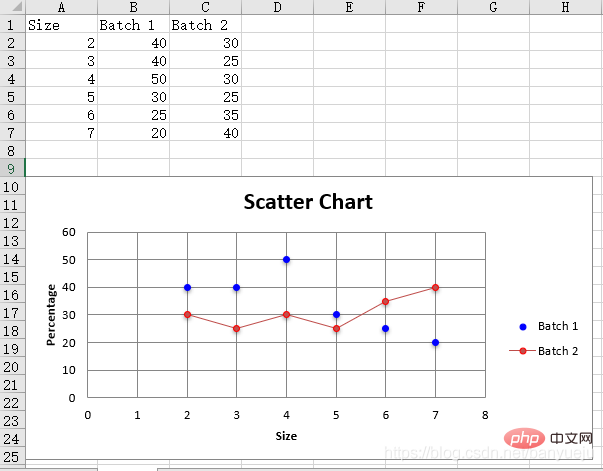
""" __author__ = '伴月雎' __time__ = '2021/4/21 19:15' """ from openpyxl import Workbook from openpyxl.chart import ( ScatterChart, Reference, Series, ) wb = Workbook() ws = wb.active rows = [ ['Size', 'Batch 1', 'Batch 2'], [2, 40, 30], [3, 40, 25], [4, 50, 30], [5, 30, 25], [6, 25, 35], [7, 20, 40], ] for row in rows: ws.append(row) chart = ScatterChart() chart.title = "Scatter Chart" chart.style = 10 chart.x_axis.title = 'Size' chart.y_axis.title = 'Percentage' xvalues = Reference(ws, min_col=1, min_row=2, max_row=7) for i in range(2, 4): values = Reference(ws, min_col=i, min_row=1, max_row=7) series = Series(values, xvalues, title_from_data=True) chart.series.append(series) # 第一條散點(diǎn) s1 = chart.series[0] # 散點(diǎn)標(biāo)記類(lèi)型 'auto', 'dash', 'triangle', 'square', 'picture', 'circle', 'dot', 'plus', 'star', 'diamond', 'x' s1.marker.symbol = "circle" s1.marker.graphicalProperties.solidFill = "0000FF" # Marker filling 設(shè)定標(biāo)記填充的顏色 s1.marker.graphicalProperties.line.solidFill = "0000FF" # Marker outline 標(biāo)記輪廓的顏色 s1.graphicalProperties.line.noFill = True # 關(guān)閉連線(xiàn)填充 # 第二條帶連線(xiàn)的散點(diǎn) s2 = chart.series[1] s2.marker.symbol = "circle" s2.graphicalProperties.solidFill = "FF0000" s2.marker.graphicalProperties.line.solidFill = "FF0000" s2.graphicalProperties.dashStyle = "dash" s2.graphicalProperties.line.width = 1000 # width in EMUs ws.add_chart(chart, "A10") wb.save("scatter.xlsx")效果如下:uwA少兒編程網(wǎng)-https://www.pxcodes.com
 uwA少兒編程網(wǎng)-https://www.pxcodes.com
大家可以根據(jù)自己的需要做相應(yīng)的擴(kuò)展:uwA少兒編程網(wǎng)-https://www.pxcodes.com
1.讀取自己的Excel表格數(shù)據(jù),替換上面代碼中手動(dòng)生成的數(shù)據(jù):uwA少兒編程網(wǎng)-https://www.pxcodes.com
wb = openpyxl.load_workbook('D:\data.xlsx') # 填寫(xiě)你的Excel文件路徑 ws = workbook['sheet1'] # 填寫(xiě)你的sheet標(biāo)題再參考上述代碼,指定你的xvalues和values(即x軸,y軸)對(duì)應(yīng)的行、列位就OK了。uwA少兒編程網(wǎng)-https://www.pxcodes.com
2.**后修改畫(huà)圖元素的屬性值,畫(huà)出你自己定制化的散點(diǎn)圖!uwA少兒編程網(wǎng)-https://www.pxcodes.com
相關(guān)免費(fèi)學(xué)習(xí)推薦:python視頻教程!
以上就是一分鐘學(xué)會(huì)用Python的第三方庫(kù)openpyxl畫(huà)真散點(diǎn)圖的詳細(xì)內(nèi)容,更多請(qǐng)關(guān)注少兒編程網(wǎng)其它相關(guān)文章!uwA少兒編程網(wǎng)-https://www.pxcodes.com

- 上一篇

《從Scratch進(jìn)階到Python—基礎(chǔ)篇》安裝python【視頻】
《從Scratch進(jìn)階到Python—基礎(chǔ)篇》第二章如何在windows下或者mac下安裝最新版的python軟件
- 下一篇

pyqt5如何設(shè)置控件透明PyQT設(shè)置控件透明度
簡(jiǎn)介pyqt5設(shè)置控件透明方法:首先使用QGraphicsOpacityEffect類(lèi)設(shè)置圖形元素的透明效果;然后使用“元素名稱(chēng).setOpacity(透明值)”設(shè)置元素的透明度,參數(shù)值在0和“1.0”之間即可。本教程操作環(huán)境:windows7系統(tǒng)、CSS3&&HTML5版、DellG3
相關(guān)資訊